

MINNEAPOLIS — Minneapolis voters are divided in their opinion of incumbent Mayor Jacob Frey heading into the 2021 city elections, while voters hold a more unfavorable opinion of the Minneapolis City Council, according to results of a new KARE 11/MPR News/Star Tribune/FRONTLINE Minnesota Poll.
The poll, conducted by Mason-Dixon Polling & Strategy, interviewed 800 registered likely voters in the city of Minneapolis between Sept. 9-13. The results were released as early voting begins in the 2021 elections, with the offices of mayor and council among those on the ballot. The citywide poll has a standard +/- 3.5% margin of error.
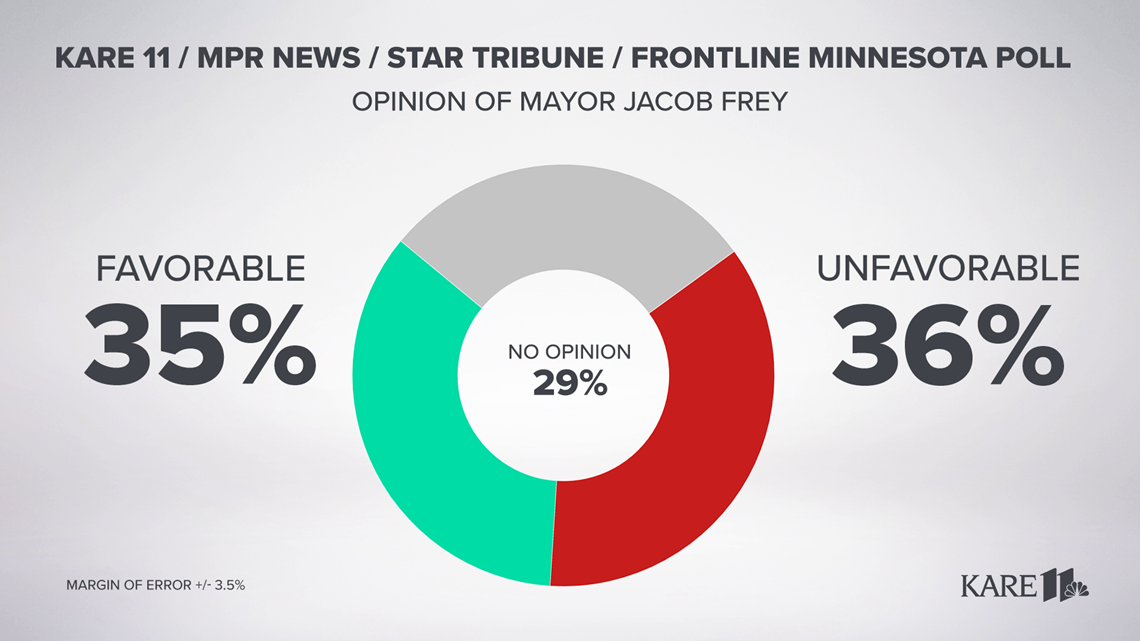
MAYOR JACOB FREY
According to the poll, 35% of Minneapolis voters reported a favorable opinion of Mayor Jacob Frey, who is seeking a second term in office. That result compares to 36% who said they have an unfavorable view of the mayor, a 1% difference which falls within the poll's margin of error. The remaining 29% of respondents had no opinion.
Frey's favorability rating is stronger among women (39% favorable vs. 33% unfavorable) than men (31% favorable vs. 40% unfavorable). He also polls stronger among older residents, with 41% of voters age 65+ having a favorable opinion of the mayor, compared to 32% for both the 18-34 and 35-49 age groups, and 38% favorable in the 50-64 age group.

Mayor Frey's strongest rating comes from Black voters, with 52% reporting a favorable viewpoint vs. 19% with an unfavorable opinion, in an oversampling of 500 Black Minneapolis voters. That figure is the only demographic group where Frey's favorability rating was above 50% in the poll. By comparison, 31% of white voters viewed the mayor favorably, with 39% reporting an unfavorable opinion.
When broken down by party affiliation, Frey, a Democrat, actually scored a higher favorable percentage from Minneapolis Republican voters (40%) than among his fellow Democrats (37%); although Republicans also reported a higher unfavorable view (51%) than Democrats (34%). Independents see the mayor slightly less favorably overall (31% favorable vs. 37% unfavorable).
CITY COUNCIL

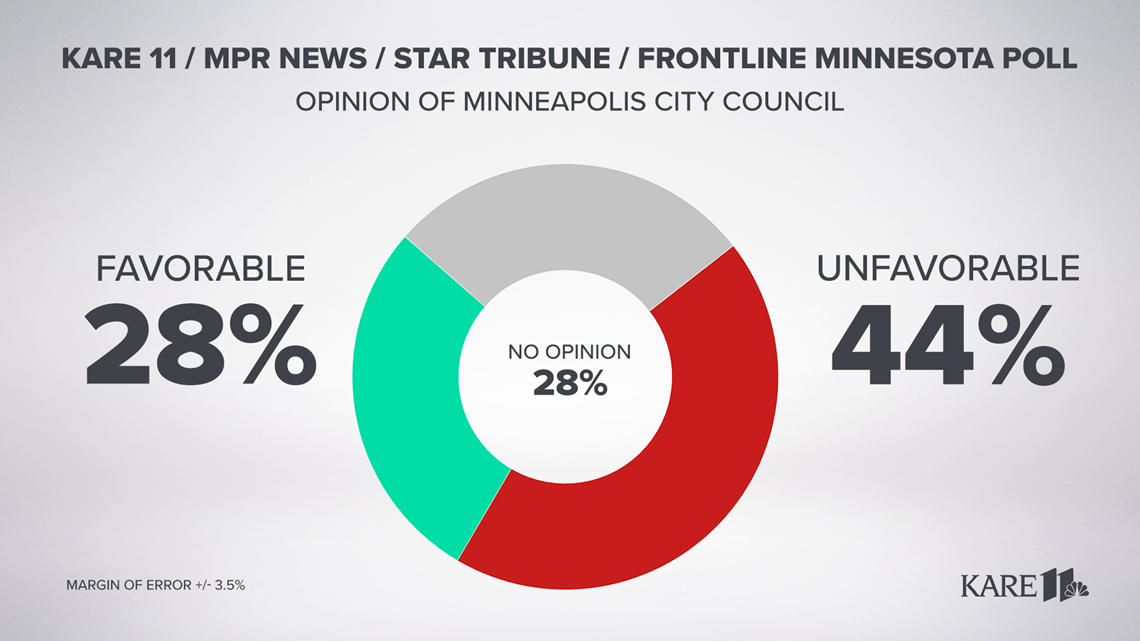
While Frey's overall polling was almost evenly split, opinions of the Minneapolis City Council were more negative.
The poll found 44% of Minneapolis voters hold an unfavorable view of the 13-member council, with only 28% reporting a favorable opinion, and another 28% saying they had no opinion about the council.
Opinions about the city council leaned unfavorable in almost every demographic breakdown, with the lone exception of Black voters (36% favorable vs. 28% unfavorable, with 36% having no opinion).
Republicans are the most dissatisfied with the council, with just 9% reporting a favorable viewpoint and 83% saying they hold an unfavorable view of the council. By comparison, 30% of Democrats and 27% of Independents have a favorable view of the council, while 42% of Democrats and 40% of Independents have an unfavorable opinion.
DECISIONS ABOUT MPD

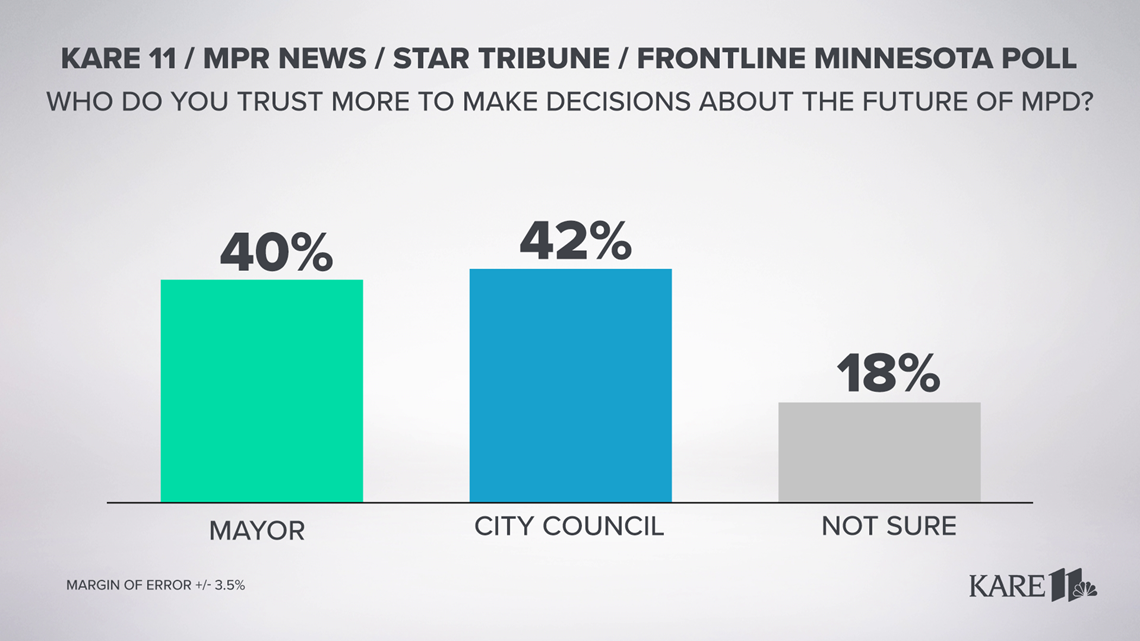
With the future of public safety and the Minneapolis Police Department remaining a key issue for the city, the poll also asked for opinions about who Minneapolis voters would trust more to make decisions about the future of MPD. Here, the city council scored slightly higher than the mayor, though within the margin of error.
The poll found 42% of Minneapolis voters trust the city council to make decisions about the future of MPD, compared to 40% who said they'd trust the mayor more. The remaining 18% were unsure.
On this question, the city council was narrowly preferred over the mayor by men (42% vs. 39%) and women (42% to 40%). White voters preferred the council (45% to 40%) while Black voters narrowly favored the mayor (38% to 35%).
By political affiliation, Democrats want the council to decide on MPD questions over the mayor (45% to 40%), as do Independents (42% to 33%), while Republicans strongly preferred for the mayor's office to hold decision-making power over the future of the police department (60% to 17%).
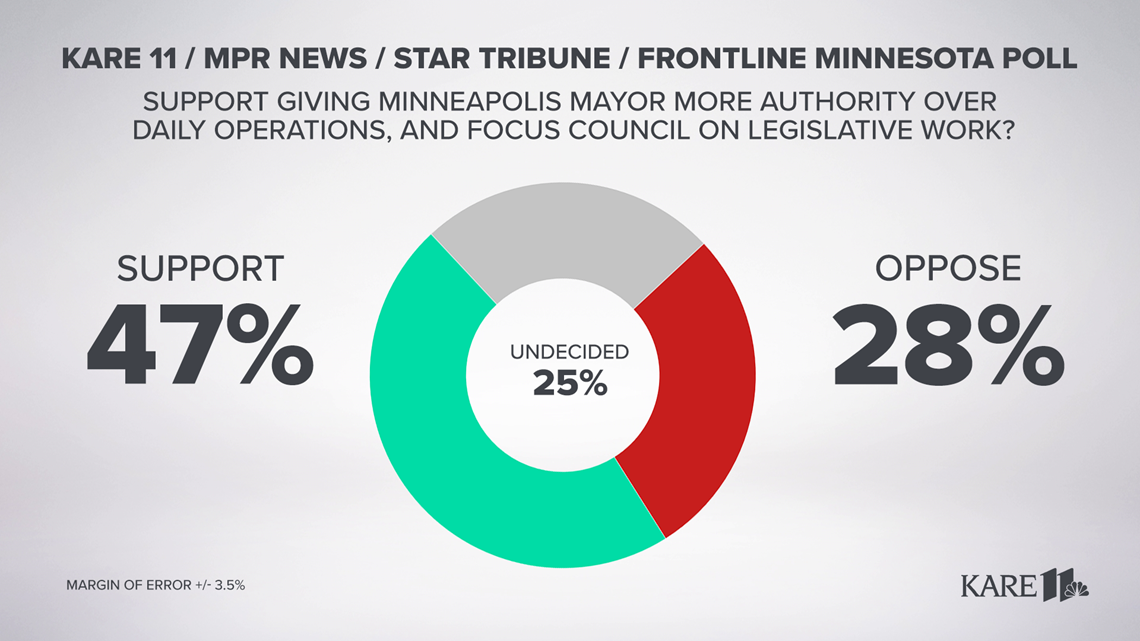
CITY CHARTER QUESTION 1

The poll also gauged opinions on three city charter ballot questions up for a vote in the Nov. 2 election.
City question 1 would change the structure of city government to an executive mayor and legislative council, where the mayor would have stronger authority over daily operations and the council would focus on writing ordinances and approving budgets.
The KARE 11/MPR News/Star Tribune/FRONTLINE Minnesota Poll found 47% of Minneapolis voters support this change, with 28% opposed and 25% undecided.
CITY CHARTER QUESTION 2

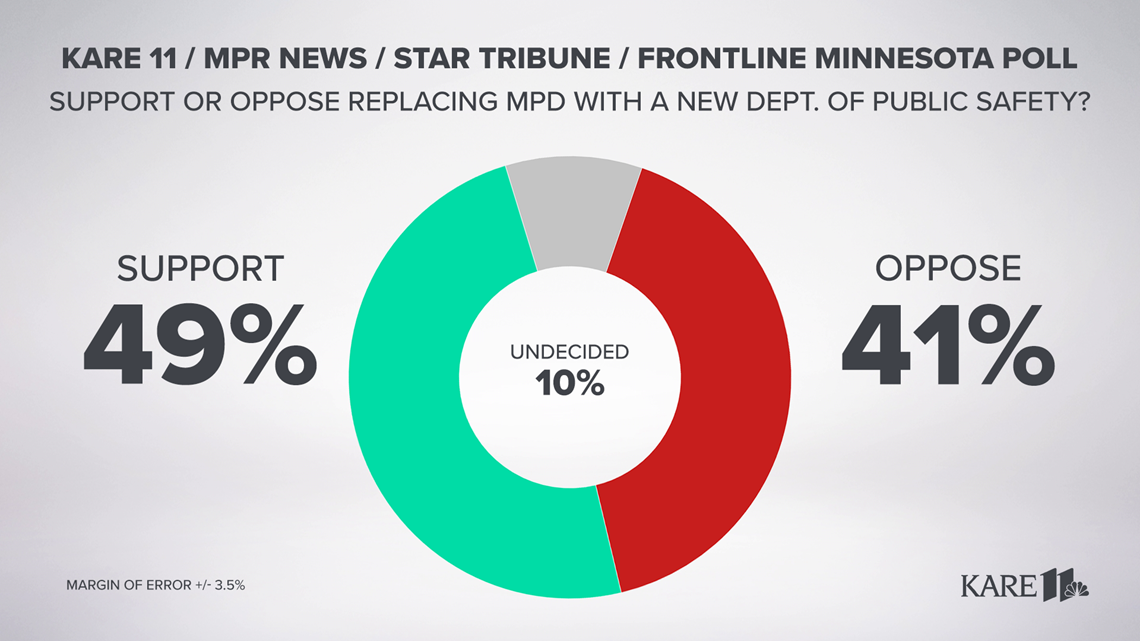
Question 2 on the ballot covers the public safety charter amendment. The Minnesota Poll found 49% of likely registered voters support replacing the Minneapolis Police Department in the city charter with a new Department of Public Safety; 41% were opposed in the poll, with 10% undecided.
CITY CHARTER QUESTION 3

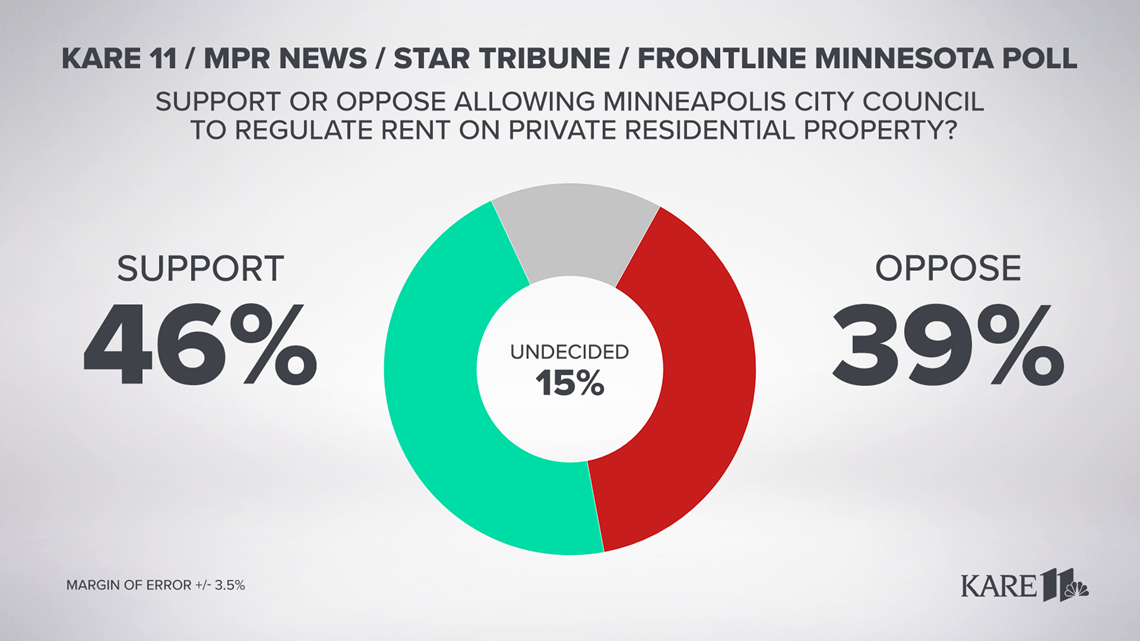
Question 3 on the ballot would give the Minneapolis City Council the power to regulate rent prices on private residential property. The poll found 46% support this measure, with 39% opposed and 15% undecided.
METHODOLOGY
The findings of this Star Tribune/MPR News/KARE 11/FRONTLINE Minnesota Poll are based on live interviews conducted Sept. 9 to Sept. 13 with 800 Minneapolis registered voters who indicated they are likely to vote in the November city election. That sample included interviews with 537 self-identified white registered voters and 157 African-American registered voters. During the same period, an additional 343 interviews were conducted with African-American registered voters in Minneapolis who indicated they are likely to vote in November, for a total of 500 interviews. This is commonly referred to as an “oversample,” and allows for an apples-to-apples comparison of the responses of white voters and Black voters, with similar margins of sampling error. The findings of this oversample appear under “Black voters” in the data tables, but these additional interviews are otherwise not included among the main sample of 800 Minneapolis registered voters. Other racial demographics are not included in the poll question data tables due to the small number of interviews conducted. This poll was conducted for the Star Tribune, Minnesota Public Radio News, KARE 11 and FRONTLINE, the PBS series, by Mason-Dixon Polling and Strategy Inc.
Those interviewed were randomly selected by computer from a phone-matched Minneapolis voter registration list that included both land line and cellphone numbers. For the sample of 800 Minneapolis registered voters, 30% of the interviews were conducted via land line and 70% via cellphone. For the sample of 500 African-American registered voters, 23% of the interviews were conducted via land line and 77% via cellphone.
The margin of sampling error for the sample of 800 Minneapolis registered voters, according to standards customarily used by statisticians, is no more than ± 3.5 percentage points. This means there is a 95 percent probability that the "true" figure would fall within that range if all voters were surveyed. The margin of sampling error for the sample of 500 African-American Minneapolis registered voters is no more than ± 4.5 percentage points. The margin of error is higher for any subgroup, such as a gender or age grouping.
Sampling error does not take into account other sources of variation inherent in public opinion surveys, such as nonresponse, question wording or context effects. In addition, news events may have affected opinions during the period the poll was taken.
The self-identified party affiliation of the respondents of the sample of 800 Minneapolis registered voters is 65% Democrats, 7% Republicans and 28% independents or other. The self-identified party affiliation of the respondents of the sample of 500 African-American Minneapolis registered voters is 69% Democrats, less than 1% Republicans and 31% independents or other.
The demographic profile of this poll of registered voters is an accurate reflection of their respective voter populations. This determination is based on more than 100 statewide polls conducted by Mason-Dixon in Minnesota over the past 32 years – a period that spans eight presidential election cycles that began in 1988.