WOODBURY, Minn. — In the next two weeks, we'll be hearing a lot about polling. As humans, we love looking at data in understandable chunks. Presidential election years are no different – in fact, it's especially so.
Politico reported, "a spate of new polling conducted before the Democratic and Republican conventions shows that Biden's advantage remains significant."
So what do we take away from those numbers? It's not as clear cut.
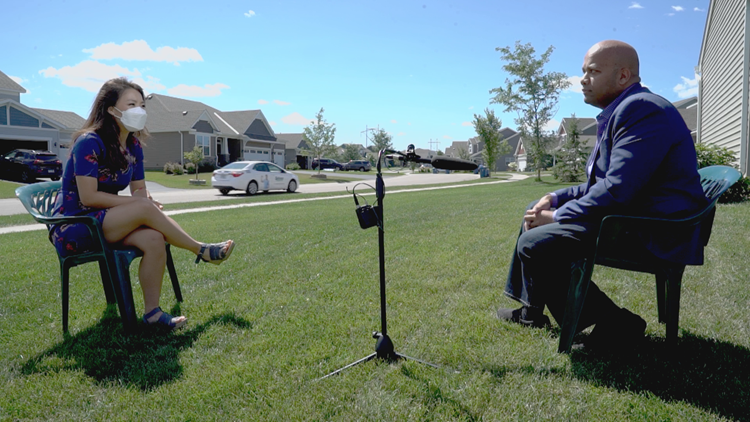
"People need to understand that these are estimates and these estimates are based on samples that are taken from the population," Dr. Manjeet Rege said. Rege is an associate professor and director of the Center for Applied Artificial Intelligence at the University of St. Thomas.
Before we dive into the nitty gritty though, we need to understand the "randomized sample."
Dr. Rege said a good poll draws its sample from a well-stirred pot of stew. No part is saltier than the other.
"You have a randomized sample that is drawn from a population, you analyze that sample and based on that, you come up with the polls," he said.
The other two things to look out for are the margin of error and confidence interval.
For example, a margin of error of two for a poll showing 51% means:
"If you had access to the entire population, which means if you had gone door to door and calculated the actual poll, which is not possible to do – then the true answer would lie somewhere 51+2 and 51-2 so it could be 49 and 53%," Rege said.
A confidence interval of 95% for a poll means:
"This is an estimate that we are coming up with – based on the sample," Rege said. "So if I had gone out there and grabbed a sample 100 times, that is a 5% chance that I could be wrong."
So we asked Dr. Rege what he thought went wrong in the 2016 polling prior to the election.
"The ways the polls are shown in the media these days – there is little attention paid to the margin of error and the confidence interval," he said. "Secondly, right before the elections, there was some information that was disclosed about one of the candidates which could be another factor as well."
That is a problem because Dr. Rege explained that as soon as new information hits the public, opinion shifts. This often renders whatever data set the poll was drawing from, obsolete.
Polls also too can have an effect on the future. For example, if the difference is big between two candidates – people might say, "why should I go out and vote?"
"Because the difference is huge, you might not actually go out there," he said. "So once again, people have to keep in mind that these are estimates and that poll was taken at a particular point in time. If everyone begins to think that way, then there's no point to go out and vote. I hope people take it as an estimate and judge it and make their decisions when they go out there and vote."
Dr. Rege added that we should always pay close attention to pie charts and donut charts.
He said humans are better at judging length rather than area. So always take those charts with a grain of salt, if you're going to be looking at them throughout the next two weeks.


